An attribute is a data value associated with a particular feature in a GIS layer—for example, the name and width associated with a particular street. Each feature in a GIS layer (Node, Polyline, or Polygon) can have its own unique set of attributes.
In CivilGEO software, attribute mapping can be performed from the Attribute Mapping panel of the GIS layer properties dialog boxes. This panel allows the user to provide different colorization styles to a selected attribute.
The user can select one of the following types of GIS layer properties dialog box:
- GIS Polygon Properties
- GIS Polyline Properties
- GIS Node Properties
In this article, we will use the GIS Polygon Properties dialog box to demonstrate how attribute mapping is performed in CivilGEO software.
Follow the steps below to access the Attribute Mapping panel:
- In the Map Data Layers panel, click on the […] button next to the desired GIS layer.
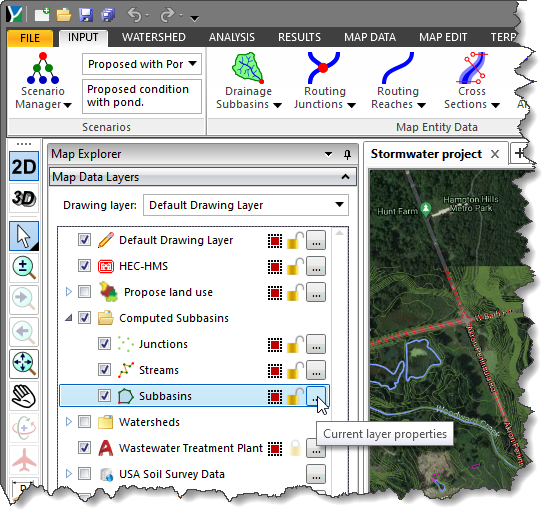
- The GIS Polygon Properties dialog box will be displayed.
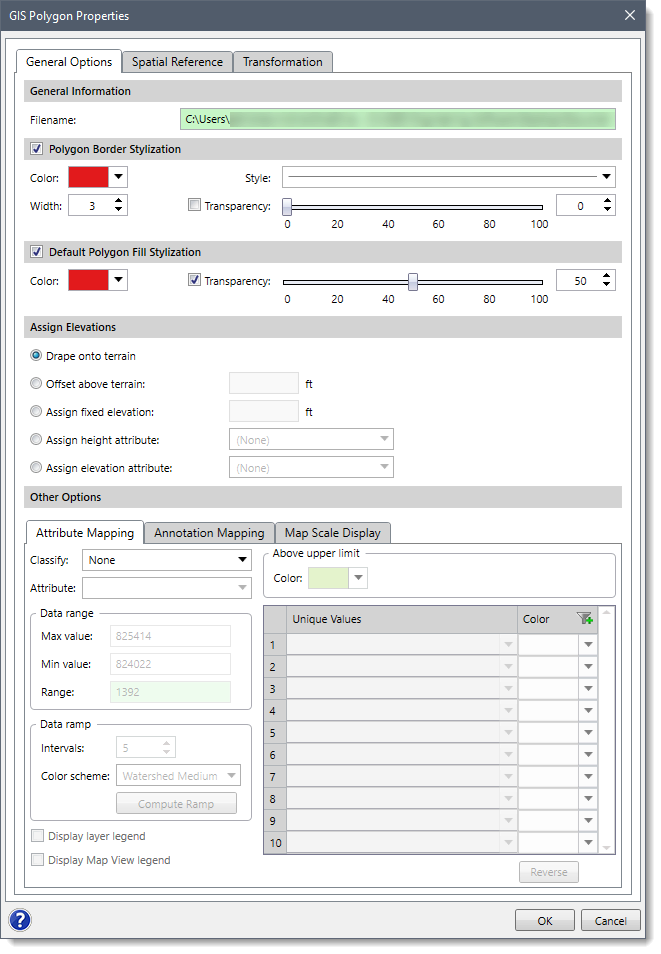
- Select the Attribute Mapping panel in the Other Options section.
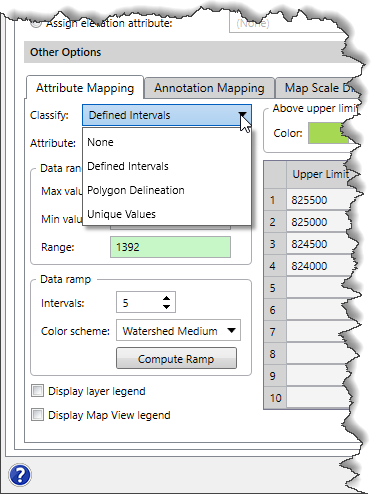
- From the Classify dropdown combo box, select the color classification method for providing different colorization styles to the attribute. The user can select one of the following options from the dropdown combo box: None, Defined Intervals, Polygon Delineation, and Unique Values.
- From the Attribute dropdown combo box, select the desired attribute for which you want to apply the colorization style.
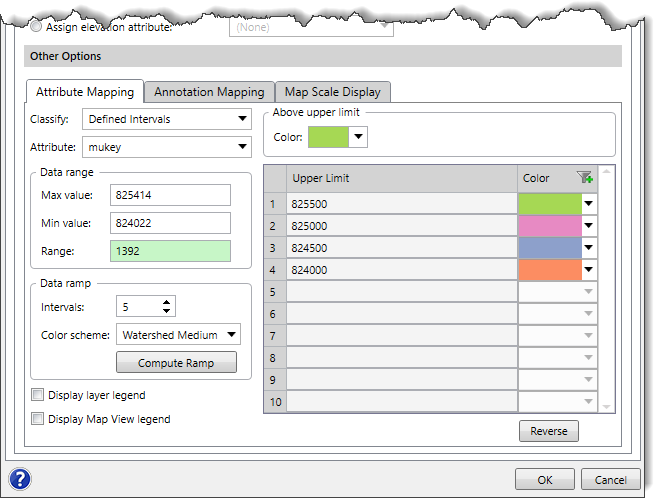
- From the Data range subsection, the user can define the range of the selected attribute values that will be utilized in the color data grid. By default, the Max value and Min value entry fields display the attribute’s maximum and minimum values respectively. However, the user can change these maximum and minimum values, and their corresponding differences will be displayed in the Range read-only field. Note that the Data range subsection can only be enabled when the Defined Intervals option is selected in the Classify dropdown combo box.
- From the Data ramp subsection, the user can define the color scheme as well as the interval for the color ramp that will be used to depict the range of color fill. Note that the Data ramp subsection can only be enabled when the Defined Intervals option is selected in the Classify dropdown combo box.
- Intervals
This spin control entry field is used to define intervals of the color ramp. Note that the interval defined in this field will create the same number of colorizations in the color data grid.
- Color scheme
This dropdown combo box is used to select the color scheme for the color ramp.
- Clicking the [Compute Ramp] button causes the software to reset the intervals and corresponding color style in the color data grid.
- From the Above upper limit subsection, the user can assign a color for all those data range values that do not fall under the defined data range. Click the Color dropdown palette to select the preferred color. Note that the Above upper limit subsection can only be enabled when the Defined Intervals option is selected in the Classify dropdown combo box.
- Check the Display Layer legend checkbox to create a color legend of the attributes in the Map Data Layers panel.
- Check the Display Map View legend checkbox to create a color legend of the attributes on the Map View.
- Click the [Reverse] button to reverse the color in the color data grid.
- Once done, click the [OK] button. The software will then display colorization styles for the selected attribute.


