Profile lines are another way of extracting linear data from a 2D flow area. Profile lines are frequently used to delineate the plot of terrain and computed water surface elevation down the centerline of a channel. Profile lines are also used to plot the time series output. In order to plot time series data for the flow crossing the line, the profile line should be drawn perpendicular to the flow direction left to right looking in the downstream direction.
In GeoHECRAS, the user can create 2D profile lines on the Map View using the Assign Profile Lines and Draw Profile Lines commands. Both commands have similar functionality but somewhat distinct workflows.
Note that these commands can only be used after a successful HEC-RAS analysis run.
Assigning Profile Lines
The Assign Profile Lines command allows the user to define a profile line from previously imported CAD or GIS data.
Follow the steps below to use the Assign Profile Lines command:
- From the Results ribbon menu, click the Profile Plots dropdown menu and select the Assign Profile Lines command.
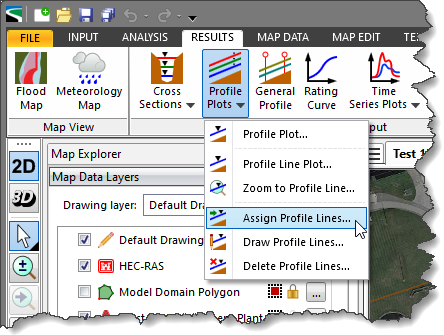
- The Assign Profile Lines dialog box will be displayed.
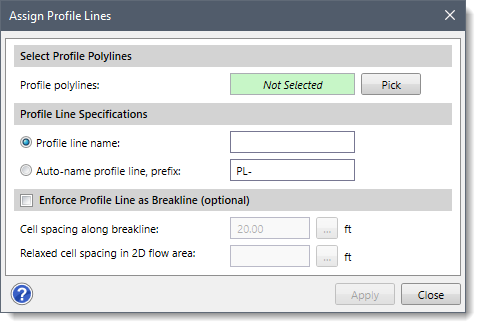
- Click the [Pick] button adjacent to the Profile polylines read-only field.
![[Pick] button](https://knowledge.dev.civilgeo.com/wp-content/uploads/sites/25/2024/04/2D-Profile-Lines-Screen-Capture-3.png)
- The Assign Profile Lines dialog box will temporarily disappear, and a prompt will be displayed on the status bar instructing the user to select a CAD or GIS polyline(s) from the Map View.
- Select CAD or GIS polyline(s) from the Map View. When finished, press the [Enter] key or right-click and select Done from the displayed context menu.
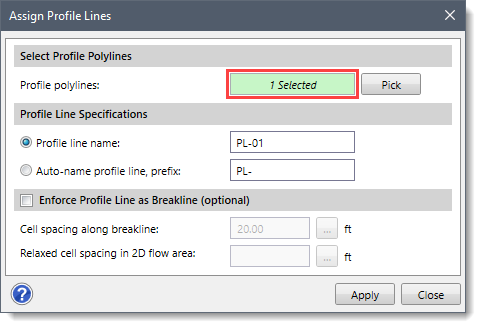
- The Assign Profile Lines dialog box will be redisplayed, and the Profile polylines read-only field will display the number of selected polyline(s).
 Notes:
- If the user selects only one polyline from the Map View, then the dialog box will be redisplayed with the Profile line name radio button option selected.
- If the user selects more than one polyline from the Map View, then the dialog box will be redisplayed with the Auto-name profile line, prefix radio button option selected.
- If a single polyline is selected, then the entry field next to the Profile line name radio button option allows the user to name the selected polyline.
- If multiple polylines are selected, then the entry field next to the Auto-name profile line, prefix radio button option allows the user to define the prefix for auto-naming the selected polylines. The software auto-names the profile lines using the defined prefix, for example, PL-##, where ## represents the profile lines count (i.e., 01, 02, and so on) and PL represents the prefix.
- The select Enforce Profile Line as Breakline (optional) checkbox option allows the user to enforce the profile line as a breakline.
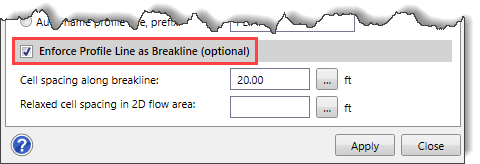 Enforcing a profile line as a breakline helps in the quick reorientation of orthogonal cells around the profile line in order to remove jaggies from a skewed profile line.
Note that the analysis of the model should be re-run after enforcing the profile line as a breakline.
- In the Cell spacing along the breakline input field, define the cell spacing value along the breakline. By default, the software uses a value of 20 ft. Alternatively, click the […] browse button to measure the cell spacing from the Map View. If this entry is left blank, then the cell spacing value in the vicinity of the breakline will be used.
- In the Relaxed cell spacing in 2D flow area input field, define the relaxed cell spacing value that will represent the cell spacing further away from the breakline. Alternatively, click the […] browse button to measure the cell spacing from the Map View. If this entry is left blank, then the cell spacing value in the vicinity of the breakline will be used.
- The values in the Relaxed cell spacing in 2D flow area and Cell spacing along breakline input fields should not be the same due to the risk of introducing cell errors along the breakline. When creating the mesh, the software will automatically and gradually transition the cell size from what is defined for the breakline and the area surrounding the breakline.
- Once all options are configured properly, click the [Apply] button. The selected polyline(s) from the Map View will be assigned as 2D profile line(s).
![[Apply] button](https://knowledge.dev.civilgeo.com/wp-content/uploads/sites/25/2024/04/2D-Profile-Lines-Screen-Capture-6.png)
Drawing Profile Lines
The Draw Profile Lines command allows the user to manually draw a 2D profile line on the Map View.
Follow the steps below to use the Draw Profile Lines command:
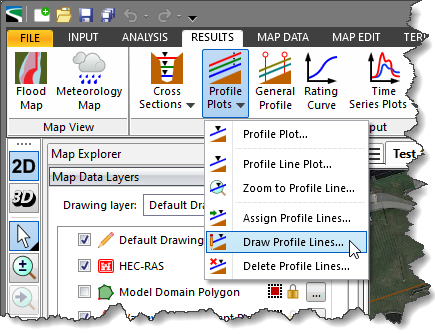
- From the Results ribbon menu, click the Profile Plots dropdown menu and select the Draw Profile Lines command.
- The Draw Profile Lines dialog box will be displayed.
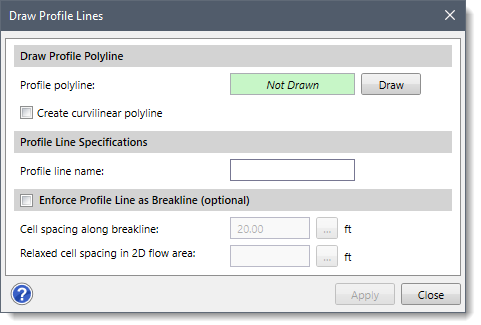
- Click the [Draw] button adjacent to the Profile polylines read-only field. Use the Create curvilinear polyline checkbox option to draw the polyline using curvilinear segments.
![[Draw] button](https://knowledge.dev.civilgeo.com/wp-content/uploads/sites/25/2024/04/2D-Profile-Lines-Screen-Capture-9.png)
- The Draw Profile Lines dialog box will temporarily disappear, and a prompt will be displayed on the status bar instructing the user to draw a profile line.
- Draw the profile line on the Map View. While drawing elements, the user can use the [Ctrl] key to switch between the curvilinear and the linear digitizing. Refer to this article in our knowledge base to learn more about drawing elements on the Map View.
- Always draw the profile line from left to right looking in the downstream direction. When finished, press the [Enter] key or right-click and select Done from the displayed context menu.
- The Draw Profile Lines dialog box will be redisplayed and the status of the Profile polyline read-only field will be changed from Not Drawn to Drawn.
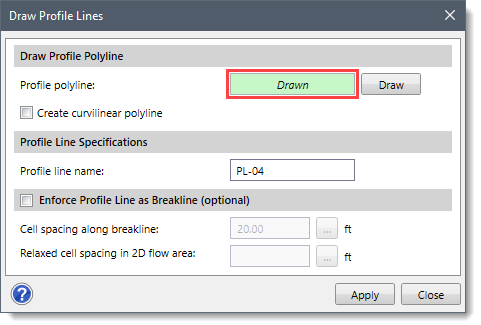
- The software automatically displays the name of the drawn profile line in the Profile line name entry field of the Profile Line Specifications section.
- The Enforce Profile Line as Breakline section of this dialog box is similar to that of the Assign Profile Lines dialog box. Refer to the Assigning Profile Lines section of this article to learn about the Enforce Profile Line as Breakline (optional) option.
- Once all options are configured properly, click the [Apply] button to assign the drawn polyline as a 2D profile line.
Displaying Profile Line Plot
The Profile Line Plot command of the GeoHECRAS software allows the user to view various types of output such as water surface elevation and terrain profile, velocity profile, flow depth profile, etc. along the 2D profile lines.
Follow the steps below to use the Profile Line Plot command.
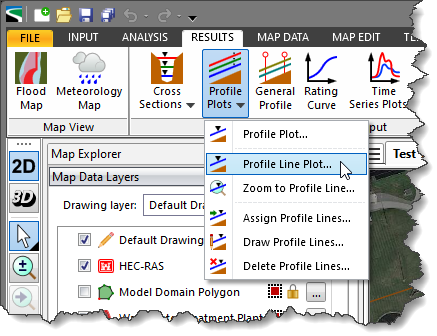
- From the Results ribbon menu, click the Profile Plots dropdown menu and select the Profile Line Plot command. Alternatively, the user can double-click on the profile line in the Map View.
- The Profile Line Plot dialog box will be displayed.
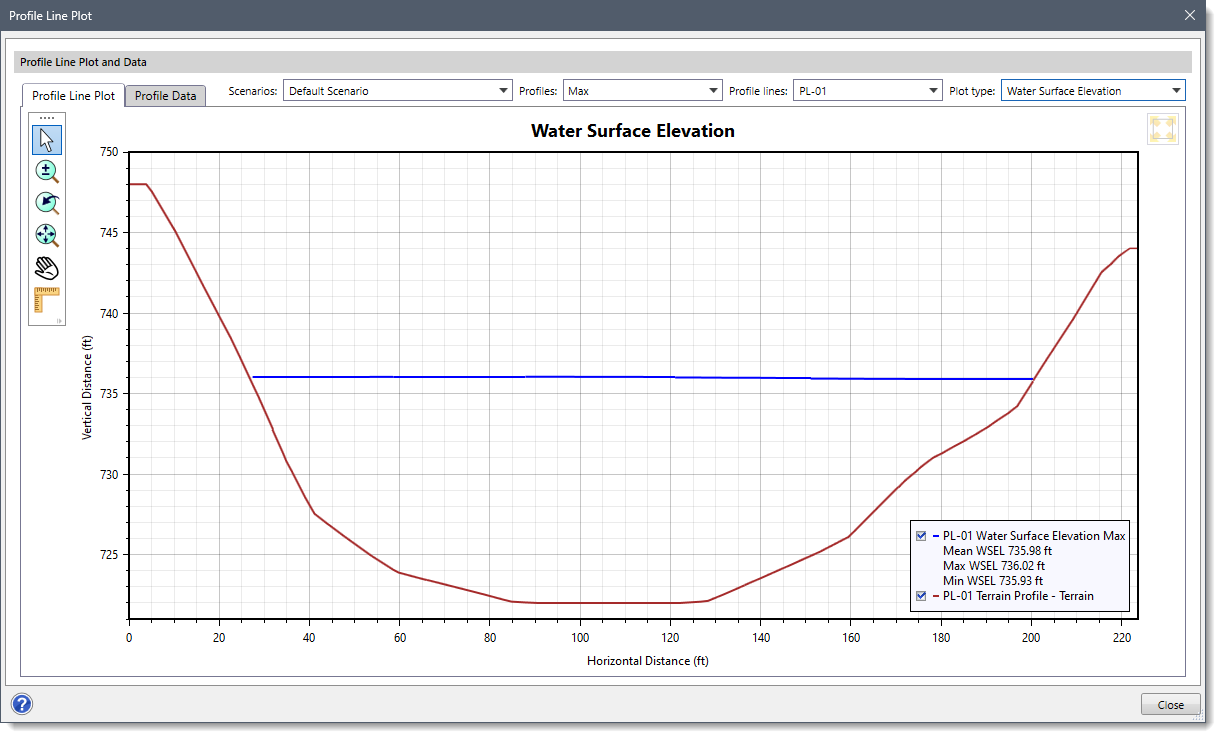
Note that while viewing the water surface elevation profile, the terrain profile is included in the plot for reference.
The following sections describe how to use the Profile Line Plot command and interact with the above dialog box.
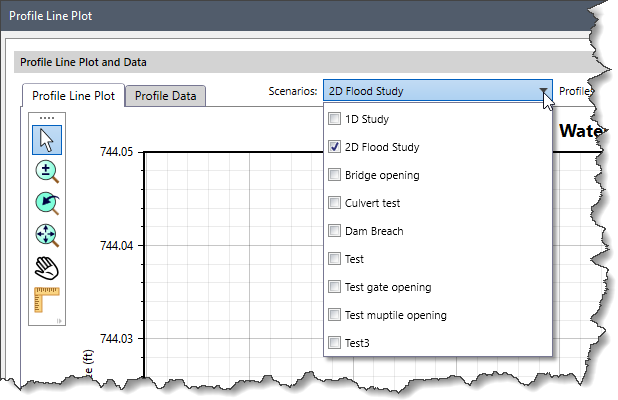
Scenarios
The Scenarios dropdown combo box allows the user to view output results from different scenarios. To learn more about working with multiple scenarios, refer to this article in our knowledge base.
Profiles
The Profiles dropdown combo box allows the user to view output results for multiple profiles at the same time. By default, the software selects the Max option.
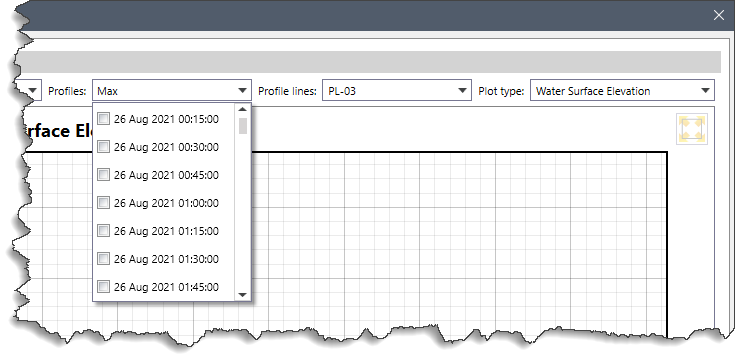
Note that the Profiles dropdown combo box will be disabled, if time series plot types are selected in the Plot type dropdown combo box.
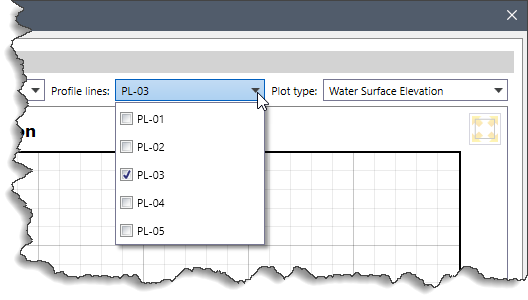
Profile Lines
The Profile Lines dropdown combo box allows the user to select the profile line(s) and view their corresponding output results.
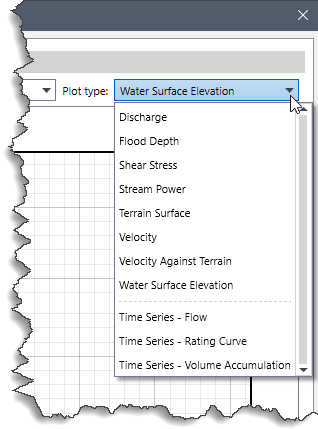
Plot type
The Plot type dropdown combo box allows the user to select the types of output results to be viewed for the selected profile line(s). The following output results options are listed in the dropdown combo box:
- Discharge
- Flood Depth
- Shear Stress
- Stream Power
- Terrain Surface
- Velocity
- Velocity Against Terrain
- Water Surface Elevation
- Time Series – Flow
- Time Series – Rating Curve
- Time Series – Volume Accumulation
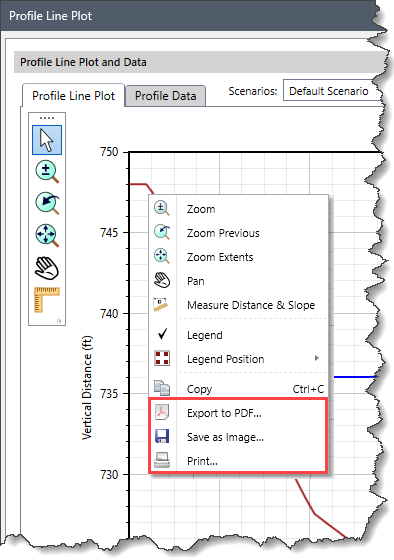
The GeoHECRAS software also allows the user to create professional printouts of profile line plots and to save them as image files as well as export them to PDF files. To print or export the results of a profile line plot into a different format, right-click anywhere on the plot and select the Export to PDF, Save as Image, or Print option.
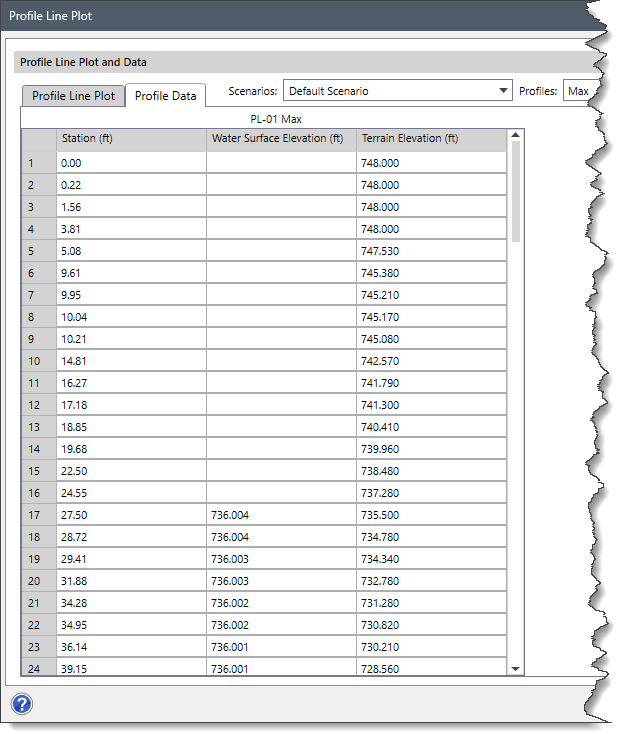
Profile Data
The Profile Data tab contains a table that displays results associated with the selected profile line(s).
Display Properties of Profile Lines
The user can also configure the display properties of profile line plots and their IDs on the Map View. To learn more about this feature, refer to this article in our knowledge base.


